

I’m setting up a full stack of platforms for logging my home lab servers.
These are my cleaned up notes from setting up Grafana and Prometheus. I’m very new at all this, and thought this might be useful to others in the same boat. It’s not a walk through, it’s just all the materials I’ve gathered and troubles I ran into along the way.
Decided to do this on my “routing” server, Polgara, because it is separate from my work horse server Durnik and is only running one other item (an important one, but only the proxy manager)
This may have been a mistake, as I kept running into issues with stopping/starting the stack, and Polgara is running the NGINX Proxy Server…it went down multiple times because of issues with the deployments.
Changes to the stack seem to take a long time or fail completely. Maybe portainer stacks are just like that? Or something is wrong with how I’m setting it up.
Logger Stack
The stack includes the following:
- Grafana for a front end with pretty dashboards
- Prometheus for consuming logs and metrics coming in from various sources
- Node Exporter for sending data about the server it’s installed on
- cAdvisor for sending data about each docker container on the server it’s installed on.
Note: cAdvisor has it’s own Web UI. But it also has a scraper /metrics endpoint for Prometheus.
This was my first attempt at creating a docker stack, prior to this I would just run one container per app.
Prometheus Yaml
The first thing you need to do is create a configuration YAML for Prometheus to pick up and use (scrapers).
These are all the places Prometheus should use to consume metrics and data - each has to be setup appropriately, of course. Kind of a chicken v egg thing here.
I put this at /docker-volumes/prometheus/config and ensured that folder and all sub-folders were owned by box464 (user 1000) but I don’t know if that’s correct or not.
I can see these job_names needing to be more descriptive as I add scrapers from other servers. Like, job_name: 'durnik-prometheus', etc
/docker-volumes/prometheus/config/prometheus.yaml
1
2
3
4
5
6
7
8
9
10
11
12
13
14

global:
  scrape_interval: 1m
  external_labels:
    monitor: "node"
scrape_configs:
  - job_name: "prometheus"
    static_configs:
      - targets: ["192.168.1.57:9091"]
  - job_name: "node-exporter"
    static_configs:
      - targets: ["192.168.1.57:9100"]
  - job_name: "cadvisor"
    static_configs:
      - targets: ["192.168.1.57:8085"]
Next up, the Stack build for Docker. This took a lot of work to get just right. Note all the volume entries with :ro at the end of the volume. This means they are being accessed as read-only, especially important as it’s giving access to very privileged areas of the system.
I think the way I have Prometheus setup below, every time the container restarts, I lose all the data it has collected.
1
2
3
4
5
6
7
8
9
10
11
12
13
14
15
16
17
18
19
20
21
22
23
24
25
26
27
28
29
30
31
32
33
34
35
36
37
38
39
40
41
42
43
44
45
46

version: "3.8"

services:
  node-exporter:
    image: "quay.io/prometheus/node-exporter:latest"
    network_mode: host
    pid: host
    volumes:
      - "/:/host:ro,rslave"

  prometheus:
    container_name: prometheus
    ports:
      - "9091:9090" #modify 9091 to your setup needs
    volumes:
      - "/docker-volumes/prometheus:/etc/prometheus" #modify the path for your install location
    image: prom/prometheus
    restart: unless-stopped
    command:
      - "--config.file=/etc/prometheus/config/prometheus.yml"

  grafana:
    image: grafana/grafana-enterprise
    container_name: grafana
    restart: unless-stopped
    user: "0"
    ports:
      - "3457:3000" #modify 3457 to your setup needs
    volumes:
      - "/docker-volumes/grafana:/var/lib/grafana"

  cadvisor:
    image: gcr.io/cadvisor/cadvisor:v0.47.0
    container_name: cadvisor
    ports:
      - 8085:8080
    volumes:
      - /:/rootfs:ro
      - /var/run:/var/run:ro
      - /sys:/sys:ro
      - /var/lib/docker/:/var/lib/docker:ro
      - /dev/disk/:/dev/disk:ro
    devices:
      - /dev/kmsg
    privileged: true
    restart: unless-stopped
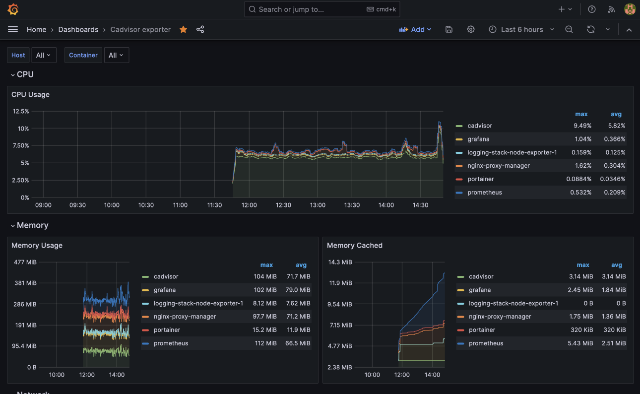
Grafana Dashboards
Following the YouTube guide, I installed these dashboards, which do seem relevant. You have to pick the appropriate data source for each during setup. Not sure how this will work when I expand over to Durnik with this.
What’s Next?
I assume I need to repeat the Node Exporter and cAdvisor installs on Durnik and anything else I might want to monitor, like piHole. Then update the Prometheus YAML accordingly, with appropriate job names. For another day.
Reference Materials
None of these how to’s got me through from beginning to end, but I did use bits and pieces from each to understand the Portainer configuration.
It feels like this setup might be a bit dated and home labbers have moved on the Loki? Not sure.
This is the one I found most helpful, but still not a copy/paste of the exact commands seen in the video.
Others I viewed while working on this
Comments
Total Interactions: 5Likes
Posts, Re-Posts and Bookmarks
Replies
No webmentions were found.